Uday Shankar Shanthamallu, Casey Kilpatrick, Alex Jones, Jonathan Rubin, Alif Saleh, Albert-László Barabási, Viatcheslav R. Akmaev, Susan Dina Ghiassian
ABSTRACT
Precision medicine’s potential to transform complex autoimmune-disease treatment is often challenged by limited data availability and inadequate sample size when compared to the number of molecular features found in high-throughput multi-omics datasets. Addressing this issue, the novel framework PRoBeNet (Predictive Response Biomarkers using Network medicine) was developed. ProBeNet operates under the hypothesis that the therapeutic effect of a drug propagates through a protein–protein interaction network to reverse disease states. ProBeNet prioritizes biomarkers by considering (1) therapy-targeted proteins, (2) disease-specific molecular signatures, and (3) an underlying network of interactions among cellular components (the human interactome). With ProBeNet, biomarkers were discovered predicting patient responses to both an established autoimmune therapy (infliximab) and an investigational compound (a MAPK3/1 inhibitor). Predictive power of ProBeNet biomarkers was validated with retrospective gene-expression data from ulcerative-colitis and rheumatoid-arthritis patients and prospective data from ulcerative-colitis and Crohn’s disease patient-derived tissues. Machine-learning models using ProBeNet biomarkers significantly outperformed models using either all genes or randomly selected genes, especially when data were limited (fewer than 20 samples). These results illustrate the value of ProBeNet for reducing features and for constructing robust machine-learning models when limited data are available. ProBeNet may be used to develop companion and complementary diagnostic assays for complex autoimmune-disease therapies, which may help stratify suitable patient subgroups in clinical trials, approve new drugs, and improve patient outcomes.
LIST OF ABBREVIATIONS
ACR (American College of Rheumatology), AD (autoimmune disorders), AIMS (Accelerate Information of Molecular Signatures), AUCROC (area under the curve of receiver operating characteristic), AUPRC (area under the precision recall curve), CD (Crohn’s disease), CMRL (Connaught Medical Research Laboratory), CSF2 (colony stimulating factor 2), CV (cross-validation), HI (human interactome), IFNG (interferon gamma), IL (interleukin), IMID (immune mediated inflammatory disease), MAPK3/1 (mitogen-activated protein kinase 3 and 1), MSRC (Molecular Signature Response Classifier), NR3C1 (nuclear receptor subfamily 3 group C member 1), RA (rheumatoid arthritis), SEB (Staphylococcus enterotoxin B), TNF (tumor necrosis factor), TNFi (tumor necrosis factor inhibitor), UC (ulcerative colitis), UMAP (uniform manifold approximation and projection)
INTRODUCTION
A key promise of precision medicine is the ability to match patient subgroups with the most appropriate treatments (1). This is achieved by discovering biomarkers that connect a patient’s biological status with therapeutic outcomes for a specific therapy. In precision medicine, biomarkers can be discovered using machine-learning models that unveil complex, generalizable patterns from large molecular and clinical datasets, usually comprising data from hundreds to thousands of patients. For example, analyzing extensive molecular and clinical datasets from cancer patients, machine-learning models found biomarkers that predict response to treatment in patients with diverse cancers (2, 3, 4, 5, 6, 7, 8). These models have substantially improved outcomes and survival rates for many cancer subtypes and greatly reduced the financial burden on health care payers (9, 10).
Biomarker discovery and validation by using a traditional machine-learning approach requires relatively large and relevant data sets. These data sets must include both high-quality molecular data collected from patients before initiation of therapy and matched clinical outcome data indicating which patients ultimately responded to treatment and which did not. Traditional machine-learning models are not generalizable when insufficient data are available. A main challenge in modeling insufficient data is the “curse of dimensionality”: the amount of data needed to generalize from machine-learning results increases exponentially as the number of features increase. In such cases, machine-learning models tend to overfit the training data: the models find biomarkers that seem to be predictive for patients in the training cohort, but are not predictive for patients in other cohorts (11, 12, 13, 14, 15). Important examples are chronic autoimmune diseases (i.e., rheumatoid arthritis, RA) and ulcerative colitis (UC; an immune-mediated inflammatory disease, IMID) (11, 12, 16, 17, 18, 19, 20, 21, 22). The volume of publicly available molecular data from complex autoimmune-disease patients is orders of magnitude less than that from cancer patients. (As of June 2023, the number of “cancer” datasets in the Gene Expression Omnibus was over one million; the number of “autoimmune-disease” datasets, only 27,000 (23).) This occurs partly because autoimmune diseases cause fewer deaths each year than does cancer (24); as a result, research pertaining to autoimmune disease garners less attention and funding than does cancer research. According to the NIH RePORTER website, the NIH invested approximately $3.4 billion for cancer research in 2022; but only $380 million for autoimmune research. Thus, employing a traditional machine-learning approach to find generalizable treatment-response patterns that predict biomarkers for existing and novel autoimmune therapies can be challenging (25).
A network-based framework, PRoBeNet (Predictive Response Biomarkers using Network medicine), that radically reduces the pool of candidate biomarkers (features) is introduced, enabling machine-learning models to be successfully trained on cohorts with relatively few samples. The premise behind PRoBeNet is that the effect of a treatment (a drug targeting a specific protein) will ripple through a cascade of protein–protein interactions; reach the disease signature (comprising a panel of proteins characteristically dysregulated in that disease); and revert signature proteins to normal (in responding patients). Therefore, PRoBeNet uses as input the treatment-targeted protein, defined by a drug’s mechanism of action, and the disease-signature proteins, defined by the biological effects of the disease. For example, to find biomarkers predicting RA-patient responses to infliximab, PRoBeNet would consider as input the infliximab-targeted protein (tumor necrosis factor; TNF) and the appropriate disease-signature cytokine proteins, such as interleukin 4 (IL4), IL6, and IL10. Abnormal expression of these cytokines is detectable in RA-patient serum years before onset of symptoms. This abnormal expression becomes increasingly prominent as the disease progresses (26, 27) and is usually targeted by RA treatments (28).
The proposed network-based framework successfully identified response-predicting biomarkers for both an approved autoimmune-disease treatment and a new investigational compound. Although PRoBeNet was developed in the context of autoimmune diseases, it can be generalized to other complex diseases if the treatment-targeted proteins and appropriate disease-signature molecules are known.
MATERIALS AND METHODS
Human interactome
The human interactome (HI) was assembled by compiling experimentally validated protein–protein interactions from 21 public databases, as described (19,29). The HI is a large network of proteins and their interactions. It represents biological processes and signaling pathways in human cells. The HI comprises mostly proteins, but also include some genes. For simplicity, only proteins (and their physical interactions) are mentioned here. For each disease, a tissue-specific subgraph was constructed by extracting the largest connected component of the HI. Each tissue-specific subgraph had only proteins and gene products expressed in the specific tissue where data were available. No restrictions were imposed on the network structure, and interactions remained without direction (as in the original HI).
Personalized PageRank
The Personalized PageRank (PPR) algorithm is a variant of the conventional PageRank algorithm. The PPR algorithm provides a user-centric view of node importance in a network, where the user’s interests are represented by a specific set of “personalization” nodes. In the HI, the algorithm operates by simulating a random walk through the network, with a bias toward personalization nodes. Starting from these nodes, the random walk follows the edges to adjacent nodes, thereby propagating the PageRank scores. The underlying equation governing the propagation of scores in PPR is
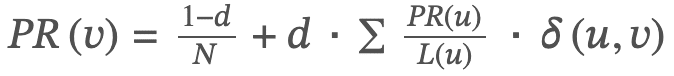
Where PR(v) is the PageRank of node v; N is the number of nodes in the interactome; d is a damping factor set to 0.85; PR(u) is the PageRank of a node u, which is connected to node v; L(u) is the number of edges connected to node u; and 𝛿(𝑢,𝑣) is a function that is 1 if node u is a personalization node, and 0 otherwise.
The personalization probabilities are equally distributed among all personalization nodes (i.e., 1/|T| for drug-target proteins and 1/|C| for disease-specific cytokines, where T is the set of drug targets and C is the set of cytokines).
The NetworkX library ver. 2.6.3 was used to implement the PPR algorithm. The PPR calculation was performed iteratively either until the scores converged or after 10,000 iterations. After this process, the algorithm yields a score for each node in the graph based on its relative importance to the specified personalization nodes. This process is run twice: first with drug-target proteins as personalization nodes, and second with disease-specific cytokines as personalization nodes. The nodes are ranked based on the two PageRank scores, and these two ranks are merged into a single combined rank by using rank product.
Logistic regression and validation
The 100 top biomarkers were selected from each ranked list and used as features to train a classifier. The scikit-learn package was used to train and validate by using an L1 regularized logistic regression model (30). Logistic regression classifier with L1 regularization can create sparse models by encouraging some feature weights to be zero. This effectively eliminates irrelevant or less-important features from the model. By reducing the number of features used in the model, L1 regularization simplifies the model and helps with its interpretation. L1 regularized models are useful for identifying important features, especially when the feature space is large. The only limitation of using L1 regularized models is that these models may be sensitive to outliers in the data. Nested cross-validation was performed to estimate model performance in an unbiased way. In the outer loop, stratified shuffle split was used to split the data: 80% of the data was used for training and for optimizing hyperparameters; and 20%, for evaluating model performance. In the inner loop, a five-fold stratified split with grid search was used to select the best hyperparameters. The hyperparameter optimization and five-fold inner-loop cross-validation ensures that only important and relevant features are selected. This process was repeated 50 times, and the average of these six performance metrics was reported: (1) The Area Under the Receiver Operating Characteristic Curve (AUCROC) reflects the model’s ability to distinguish between classes, with higher values indicating better discriminative power. (2) The Area Under the Precision-Recall Curve (AUPRC) and Average Precision are especially relevant for imbalanced data, indicating the model’s accuracy in identifying true positives. AUPRC represents the model’s ability to return relevant instances, with higher areas indicating better performance. (3) Average Precision (AvgPrecision) aggregates the precision-recall trade-off across different thresholds, summarizing the curve into a single value for easy comparison. (4) Accuracy provides a general success rate. (5) Balanced Accuracy ensures equal representation of all classes. (6) F1 Score offers a harmonious balance between precision and recall by combining these two into a single metric.
UC cohort for retrospective validation
Two publicly available datasets associated with UC (Gene Expression Omnibus website: http://www.ncbi.nlm.nih.gov/geo; last accessed June 25, 2024, using accession numbers GSE14580, GSE12251) were collected from Gene Expression Omnibus (23). In the first cohort (GSE14580), 24 patients (14 men and 10 women) with active UC, who were refractory to corticosteroids and/or immunosuppression, underwent colonoscopy with biopsies from diseased colon tissues at least one week before receiving their first intravenous infusion of infliximab (5 mg/kg body weight). The median age of responders at time of first infusion was 28.4 years; and of nonresponders, 45.8 years. Response to infliximab was defined as endoscopic and histologic healing four to six weeks after the first infusion. In the second cohort (GSE12251), 22 patients (10 men and 12 women) underwent colonoscopy with biopsy before infliximab infusion (two samples were derived from the same patient). The median age of responders at time of first infusion was 39.0 years; and of nonresponders, 51.5 years. Response to infliximab was defined as endoscopic and histologic healing after eight weeks. For both cohorts, total RNA was isolated from colonic mucosal biopsies, labeled, and hybridized to Affymetrix Human Genome U133 Plus 2.0 Arrays (ThermoFisher, Santa Clara, CA). Batch effects among studies were corrected by using ComBat ver. 3.44.0. The combined cohort consisted of 20 responders and 26 nonresponders. UC patients in these cohorts shared similar demographic characteristics (i.e., age, weight, duration of disease) [31].
RA cohort for retrospective validation
Patients with a clinical diagnosis of RA were included in the Molecular Signature Response Classifier (MSRC) test arm (32). Patients were at least 18 years of age and had never received TNF-inhibitor (TNFi) treatment (N = 107). However, methotrexate is usually the first line of treatment prescribed for RA (a common DMARD). About one third of patients in the RA cohort have taken methotrexate in the past year. And very few patients have taken Prednisone which is a corticosteroid. Patient data were collected in the Study to Accelerate Information of Molecular Signatures (AIMS) between August 2020 and August 2022. All patients in this study had moderate-to-high baseline clinical disease activity scores (>10). All patients were treated with TNFi after the study began. Patients included were those for whom clinical disease activity data were available from both baseline and six-month follow-up visits (± four weeks). American College of Rheumatology (ACR) scores were calculated for each patient to determine response to therapy. ACR scores are subjective scores used to evaluate how well RA patients respond to treatment. They are derived from ACR criteria and represent percentage improvement in these symptoms: the number of swollen or tender joints; patient and physician evaluations of pain and overall health (made by using the health assessment questionnaire disability index); and serological and blood-marker levels (i.e., C-reactive protein, erythrocyte sedimentation rate) (30, 33, 34). For example, the ACR20 score indicates a 20% improvement in the number of tender and swollen joints; the ACR50, a 50% improvement; and the ACR70, a 70% improvement. As determined by six-month ACR50 scores, the RA cohort (N = 107) comprised more non-responders (N = 82) than responders (N = 25), consistent with insufficient infliximab response being common among RA patients. Most patients were women (78%, 84 of 107), as in the general RA population. Overall, these demographics suggested the cohort well represented the general population of RA patients.
UC and CD patient tissue collection for prospective validation
Colon or ileum tissue sections were obtained from four UC and eight CD patients undergoing therapeutic resection surgery. Tissues were maintained in tissue solution until use. The final cohort GSE261205 (Gene Expression Omnibus website: http://www.ncbi.nlm.nih.gov/geo; last accessed June 25, 2024, using accession number GSE261205) consisted of seven women and five men. The patients in this cohort were previously treated with variety of DMARDs such as azathioprine, Remicade, albuterol. Due to the small sample size, inclusion criteria w.r.t previous therapy exposure was not imposed.
Ex vivo cultures
Biopsy tissues (5 mm2) were cultured in triplicate in 12-well plates containing a modified Connaught Medical Research Laboratory (CMRL)–based cell-culture media. Tissues were positioned such that the apical mucosal surfaces faced the liquid–air interface. Culture plates were incubated in media (37 °C, 5% CO2) with either test compounds or vehicle. Tissues were treated with Staphylococcus enterotoxin B (List Biological Laboratories, Campbell, CA) to stimulate inflammatory cytokine secretion. Cell-culture supernatants (∼1 mL) were collected and flash frozen 18 hours after treatment. Two samples from each condition were stabilized in RNAlater (Invitrogen, Carlsbad, CA) and frozen.
Cytokine analysis
Disease-signature cytokines were selected for analyses if their dysregulation associates with either RA or UC, or if they are generally important for inflammation (35, 36, 37, 38). For UC and CD patient-derived tissues, supernatant-cytokine levels were analyzed with the Luminex 200 platform by using Miliplex MAP kits (Merck Millipore, Burlington, MA), according to manufacturer’s instructions. These 15 cytokines were measured: CSF2, IFNG, IL10, IL-12A/B, IL13, IL17A, IL1B, IL2, IL4, IL5, IL6, IL7, IL8, CCL2, and TNF. All measurements were made in duplicate.
RNA extraction and sequencing
RNA was extracted from homogenized tissues in lysis buffer with a bead-mill homogenizer and isolated with a spin-column chromatography kit. A method optimized for gut tissue was used. To summarize, tissue lysates were treated with Proteinase K, lysates were centrifuged, and ethanol was added to supernatants. Solutions were loaded onto spin columns, and samples on columns were digested with DNase. Columns were then iteratively washed, and total RNA was eluted with nuclease-free water. RNA quality was assessed: sample concentrations were confirmed to be ≥20 ng/μL (≥0.4 μg yield in ≥20 μL), and RNA integrity numbers were confirmed to be ≥6.8 (with flat baselines).
Paired-end reads (150-nucleotides long) were mapped to the human genome (GRCh38) with STAR alignment software ver. 2.7.3a (39, 40). Per gene abundance in fragments per kilobase of transcript per million mapped reads was calculated with the RSEM software package ver. 1.3.1 (41).
Cytokine-response score
The cytokine-response score for a donor 𝑑 was defined as the following weighted sum:
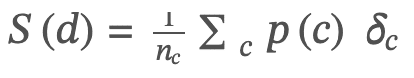
Here 𝑝(𝑐) is the average percentage change in the level of the cytokine 𝑐 after treatment with respect to stimulated controls,
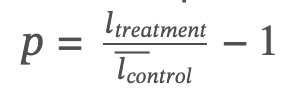
𝑛𝑐 is the number of cytokines for which this percentage can be computed (i.e., there are no indeterminate values); and 𝛿𝑐 is the indicator function that is +1 if cytokine 𝑐 is anti-inflammatory (expected to increase when inflammation decreases) and –1 if pro-inflammatory (expected to decrease when inflammation decreases). A given donor 𝑑 was called a responder if that donor’s cytokine score 𝑆(𝑑) met or exceeded a pre-defined threshold, 𝑆𝑐𝑢𝑡𝑜𝑓𝑓 (20%).
Statistical analyses
A two-tailed t-test from stats library in scipy package ver. 1.5.4 (42) was performed to assess significance of differences in model performances (for each of six performance metrics) between the PRoBeNet biomarkers, all genes, and 100 randomly selected gene sets. Alpha was set at 0.05. For comparing different rankings of genes obtained by using various measures of centrality, Kendall’s tau statistic (a non-parametric approach) was used.
Ethics approval and consent to participate
All procedures involving human participants in this study were performed in accordance with the local ethical standards as defined by the relevant state, regional, or national regulatory body, and in line with the aims and principles of the 1964 Helsinki Declaration and its later amendments. Informed written consent was obtained from all individual participants involved in the study. Approvals were granted by the West of Scotland Research Ethics Committee (22/WS/007) and by the Institutional Review Board responsible for each tissue collection site.
Overview of the biomarker-discovery framework
A novel network-based framework—PRoBeNet (Predictive Response Biomarkers using Network medicine)—for discovering treatment-response biomarkers relies on protein interactions integrated by the HI. In the HI, nodes (N = 18,627) represent proteins and edges (N = 439,260) represent experimentally validated binding interactions among these proteins (Materials and Methods). To find biomarkers for autoimmune disease (RA) and IMIDs (UC, CD), a subgraph of the HI specific to each disease was constructed; thus, each subgraph comprised protein products of genes expressed in specific tissues where data were available (whole blood for RA, colon tissue for UC and CD; Materials and Methods) (43).
Next, two key protein sets in each HI subgraph were considered: protein(s) targeted by the therapeutic drug (i.e., TNF, targeted by infliximab), called source node(s); and the repertoire of disease-signature cytokines, called readout nodes (27). Readout nodes were objectively selected by either of these criteria: being generally important for inflammation or being characteristically upregulated or downregulated in RA or UC patients (see Materials and Methods and Supplementary Table S1) (22, 27, 28, 44, 45). In this framework, the expectations were that a drug would first affect its target protein(s); then, intermediary proteins; and ultimately, the disease-signature cytokines. Intermediary proteins most critical for relaying these effects were expected to comprise the most important response-predicting biomarkers. This strategy is agnostic to the amount of patient data available, since it requires only three inputs: (1) source node(s), (2) readout nodes, and (3) tissue-specific HI subgraph.
All nodes of the HI subgraph were ranked with the personalized PageRank algorithm to measure their random-walk-based scores relative to both source nodes and readout nodes (Figure 1A,B) (46). Two scores were obtained for each node by running the PageRank computation twice: first, by using drug-target proteins as the starting nodes; and again, by using disease-signature cytokines as the starting nodes. The choice of the PageRank algorithm was driven by its ability to integrate the impact of the network topology, as well as by its robustness against noise and uncertainties in the network structure. Furthermore, the personalization aspect of the PageRank algorithm further allowed computations to be specific to drug targets and cytokines relevant to the disease being studied.

00161-2&id=gr1.jpg)
The two scores yielded two rankings for each node (𝑣):𝑟𝑠𝑜𝑢𝑟𝑐𝑒(𝑣) corresponded to node 𝑣‘s ranking personalized to drug-target proteins (Figure 1A); and 𝑟𝑟𝑒𝑎𝑑𝑜𝑢𝑡(𝑣) corresponded to node 𝑣‘s ranking personalized to disease-signature cytokines (Figure 1B). Source and readout rankings were combined by using a rank product (47) (Figure 1C) for node 𝑣as
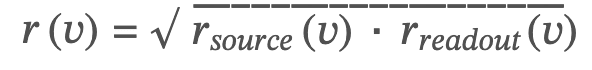
The rank product was chosen (as opposed to other options, like summation) because the ranking distribution follows a Fat-tailed distribution, indicative of multiplicative processes. Importantly, the rank product is also robust to variations in data quality and scale, making it particularly suitable for integrating two ranks. By rank product, high-ranking nodes were more central than low-ranking ones on the paths between source and readout nodes. The top 100 ranked nodes were selected as candidates for treatment-response-predicting biomarkers and for further validation. These biomarker rankings were compared with rankings from the most common network-centrality measures, such as degree centrality, betweenness centrality, and generic PageRank. The rankings did not correlate, indicating that PRoBeNet captures metrics beyond node degree and global centrality (Supplementary Figure S1).
RESULTS
Retrospective and prospective validation of response biomarkers
The predictive power of the PRoBeNet biomarkers was retrospectively validated in two cases and prospectively validated with an investigational drug (Table 1, Figure 1D–F). For UC and RA, only a third to a half of patients respond to the anti-TNF monoclonal antibody infliximab (48). To identify biomarkers of response, models were built and validated with real-world data from UC (N = 47) and RA patients (N = 107). Following current guidelines, the predictive models were built to assess drug response six to eight weeks after UC patients start treatment; and around six months after RA patients start treatment (See Discussion). For prospective validation, biomarkers predicting response to the investigational compound KO-947, which inhibits MAPK3/1 (a potential target for treating UC and CD patients), were prospectively evaluated with data from four UC and eight CD tissue-donor patients (49). For this assessment, gene-expression levels were measured in tissue collected before treatment and cytokine levels were assayed in tissue collected both before and after treatment (Materials and Methods). For each donor, cytokine (N = 15) levels from samples collected before and after treatments were used to identify patients as either responders or non-responders. Gene-expression levels from samples collected before treatment were used to predict response labels.
Repeated cross-validation was used to train and test models predicting infliximab response (Figure 1G). Because of the small sample size used for the MAPK3/1-inhibitor-response model, unsupervised clustering was used to assess that model’s predictive power (Figure 1H).
Discovery and validation of biomarkers predicting response to infliximab in UC patients
To discover treatment-response-predicting biomarkers of infliximab in UC, TNF (the source node), the UC-signature cytokines (readout nodes; Supplementary Table S1), and the colon-specific HI subgraph were used to rank biomarkers of response (Materials and Methods). Ranked (PRoBeNet) biomarkers were then validated by using pre-treatment gene-expression data from colonic mucosal biopsies from two UC-patient cohorts (Materials and Methods) (50). The cohorts were combined, and batch correction was performed (Materials and Methods). In this combined cohort, patient-derived samples (N = 47; 20 responders and 27 non-responders) were treated with infliximab. The combined cohort and the PRoBeNet biomarkers were used to build and train an L1 regularized logistic regression model. Cross-validation was performed with 80% of the data, and model performance was evaluated with the remaining 20% (Materials and Methods). Model training and validation were repeated across 50 splits to ensure the results were robust and consistent (Figure 1G). A nested cross-validation scheme was used to avoid overfitting the model to the training data, and an L1 regularization was used to eliminate non-informative features.
Model performances were then compared across three feature sets used to train the model: (1) RAND, 20 sets of 100 randomly selected genes (a random control); (2) ALL, a set comprising all genes (the traditional approach); and (3) PRoBeNet, a set comprising the top 100 ranked genes. The RAND model used consists of the same number of features as PRoBeNet predicted biomarkers, chosen at random. The random nature of feature selection in this model ensures inclusion of features with no known association to response and thus serving as a negative control. The RAND model should be unable to learn meaningful patterns from randomly selected genes and should thus perform poorly when using these genes. Indeed, the RAND model had the lowest prediction accuracy (AUCROC, 0.65; Figure 2A). Noise may be introduced in the ALL model because many irrelevant or less informative features may be included that can negatively impact the model’s predictive performance. Given the complexity and noise inherent in genomic data, the ALL model may not be optimal (AUCROC, 0.75). Focusing on a subset of genes (i.e., PRoBeNet biomarkers) is often more productive than focusing on all genes. Indeed, the model relying on the PRoBeNet biomarkers (100 top-ranked) significantly outperformed (p-value < 0.05) the other two models as assessed by several performance metrics (AUCROC, AUPRC, average precision, classification accuracy, balanced accuracy, and F1 score; Figure 2A). The precision-focused metrics (AUPRC and average precision) and the harmonic F1 score highlighted the model’s adeptness at correctly identifying true non-responders of infliximab therapy in UC. Additionally, PRoBeNet classification accuracy and balanced accuracy were superior to those of other models, confirming its consistent performance even when accounting for class imbalances. Accuracy improved from 0.70 (ALL) to 0.75 (PRoBeNet). This improvement in predicting patient response becomes predominant in the context of making clinical decisions. When extrapolated to a large cohort of 10,000 patients, the improvement in accuracy afforded by PRoBeNet could better stratify patients and lead to better treatment decisions for an additional 500 patients. This improvement offers substantial real-world benefits, including optimized patient care, fewer adverse effects, and potentially improved survival rates, underscoring the value of this approach in the context of treating IMIDs.

The performance of PRoBeNet biomarkers when patient data was limited was evaluated by artificially reducing the amount of patient data (through 10 random samplings) used to train and validate the model. This analysis allowed both an assessment of the power of PRoBeNet biomarkers under limited-data circumstances and an estimate of the minimum sample size required by the method. Even when using as few as 14 samples (a third of the data), the performance of PRoBeNet model (AUCROC, >0.8) consistently surpassed performance of the other models (AUCROCs, 0.65–0.75; Figure 2B). The performance of the ALL model linearly correlated with sample size, illustrating that traditional machine-learning tools need large cohorts to accurately identify and filter biomarkers.
Next, the effect of number of top-ranked PRoBeNet biomarkers on model’s performance was studied. Model performances were compared after varying the number of top PRoBeNet biomarkers used to train the model (from 50 to 500, in increments of 50). In all variations using more than 100 biomarkers, the PRoBeNet model outperformed the other models when the top-ranked features exceeded 100 (Figure 2C). Overall, these results confirm that the biomarkers found by PRoBeNet are more predictive than both RAND and traditionally modeled biomarkers. These results also show how PRoBeNet can take advantage of limited-size datasets for building predictive models.
Discovery and validation of biomarkers predicting response to infliximab in RA patients
In theory, the PRoBeNet framework is capable of detecting and identifying response biomarkers in other disease states by modifying source nodes, readout nodes, and HI subgraphs. To assess the value of this approach in a different context, the framework was used to find infliximab-response-predicting biomarkers for RA, an autoimmune disease. Infliximab-targeted TNF protein was retained as the source node, but RA-signature cytokines (rather than UC-signature ones) were used as readout nodes (Supplementary Table S1). Also, a whole-blood-specific HI subgraph was constructed, since whole-blood RA gene-expression data were now used for validation (Materials and Methods). With these three inputs (source node, readout nodes, and whole-blood subgraph), nodes in the whole-blood-specific HI were ranked and the top 100 ranked nodes were selected as response-predicting biomarkers. Baseline gene expression, measured in whole blood from RA patients (N = 107) before treatment, was used to assess the predictive power of the biomarkers (Materials and Methods) (32). Patient clinical data needed to calculate American College of Rheumatology (ACR) treatment-response scores were collected at baseline and at six-month follow-up visits. Patients were defined as either responders or non-responders to infliximab treatment by using six-month ACR50 scores (Materials and Methods).
Predicted biomarkers were validated for the RA-patient cohort by using the same strategy as that used to validate UC-patient-cohort biomarkers. The RA-patient cohort and the PRoBeNet biomarkers were used to train and validate the model (Figure 1G). By multiple metrics, the model trained on PRoBeNet biomarkers significantly outperformed the models trained on either ALL or RAND genes (Figure 3A). The model trained on ALL performed worse than the model trained on RAND genes (100 genes/set), as with many features (ALL set) machine-learning models tend to overfit to noise in training data. Although the outperformance by PRoBeNet model compared to ALL and RAND is small, the outperformance is still significant. This can be attributed to the low signal-to-noise ratio in RA data.

The sample-size analysis was repeated for the RA-patient cohort to emulate the real-world scenario of data paucity. With as little as half of the data (N = 53), the ranked-biomarker model consistently outperformed the other models (Figure 3B). Thus, even with limited patient data, the PRoBeNet biomarkers predict responders from non-responders better than do other models. Model performance peaked when using around 100 PRoBeNet biomarkers (Figure 3C), indicating that PRoBeNet captured the biomarkers with the greatest predictive value.
Physician and patient assessments of RA severity and treatment responses are subjective. This subjectivity may introduce ambiguity in ACR scores (used to build and validate response-predicting models for RA). To reduce this ambiguity, the analysis was repeated by including only extreme-responder RA patients (who achieved ≥70% improvement in RA symptoms, as assessed by six-month ACR70) and extreme-non-responder patients (who achieved <20% improvement, as assessed by six-month ACR20). When using these patients, the ranked-biomarker model (AUCROC, 0.64) further outperformed the other models (RAND AUCROC, 0.46; ALL, 0.5; Supplementary Figure S2). For insight into the biology determining whether RA and UC patients will respond to TNFi, pathways overrepresented by PRoBeNet biomarkers (top ProBeNet biomarkers for RA and for UC) were identified by using Metascape. Several canonical pathways related to TNF and cytokine signaling were enriched in both the RA and UC biomarkers. Comparing the enriched pathways for each disease revealed several UC-specific pathways, such as cadherin and endothelial cell adhesion, thereby yielding further disease-specific insights from the predicted biomarkers (51) (Supplementary Figure S3). Overall, these results indicate that the PRoBeNet captures response-predicting biomarkers for different diseases, even when using limited data.
Prospective discovery of biomarkers predicting response to MAPK3/MAPK1 inhibitor
Precision medicine has the potential to improve drug-response rates by revealing biomarkers of therapeutic response, thus enabling identification of patients who carry these biomarkers. Knowledge of such biomarkers may also translate into FDA approval for drugs that are administered with an accompanying diagnostic tool. To test this hypothesis, a preclinical validation experiment was designed to test the performance of PRoBeNet biomarkers in predicting responses to the investigational compound KO-947, whose mechanism of action differs from that of infliximab. KO-947 inhibits mitogen-activated protein kinase 3 and 1 (MAPK3/MAPK1), which modulate inflammatory cytokine signaling; thus, KO-947 may be efficacious for treating autoimmune diseases and IMIDs (52). Molecular and outcome data were prospectively generated for validating this approach in a preclinical setting (Materials and Methods) (53). PRoBeNet biomarkers were identified by using MAPK3 and MAPK1 as source nodes; 15 cytokines (both pro-inflammatory and anti-inflammatory), whose levels were measured as readout nodes (Supplementary Table S1); and the colon-specific HI subgraph. Despite the differences in UC and CD etiologies, MAPK3/1 inhibitors work in UC-derived tissues as they do in CD-derived ones (by reducing cytokines). Colon or ileum samples were collected from four UC and eight CD patients undergoing therapeutic resection (Figure 4A). Tissue samples were cultured and treated either with Staphylococcus enterotoxin and vehicle (baseline samples) or Staphylococcus enterotoxin and KO-947 (treated samples). Disease-signature cytokines secreted into media and gene expression in tissue were measured for all samples (Materials and Methods). Response scores for patients were calculated by using changes in cytokine-expression levels between baseline and treated samples and across replicates (Materials and Methods). The response scores for UC and CD samples differed among donor types (Table 2), confirming this ex vivo experimental approach was appropriate for discovering response biomarkers in a preclinical setting.

Given the few samples, the power of the identified biomarkers to segregate responders from non-responders was validated by analyzing cytokine-derived response scores with an unsupervised clustering approach. The top 100 PRoBeNet biomarkers were used as features, and dimensionality reduction was performed by using a uniform manifold approximation and projection (UMAP) algorithm. Three-fourths of samples (9 of 12) were properly classified by treatment-response levels (Figure 4B). To compare the predictive power of the PRoBeNet biomarkers with the power of the traditional approach, UMAP was implemented on data from ALL; here, the samples did not clearly cluster (Figure 4C). The hierarchical clustering analysis (HCA) performed with the PRoBeNet biomarkers had fewer misclassifications (3 of 12) than did HCA performed with ALL genes (5 of 12) (Supplementary Figure S4). These results were quantitatively compared by using the adjusted rand score, a clustering similarity metric that ranges from –1 to 1, where a higher score indicates better clustering and a score of 0 suggests random labeling. The adjusted rand score for clustering with the PRoBeNet biomarkers (0.1773) was significantly higher than that for clustering with the ALL biomarkers (–0.0433; p value = 0.0109; Supplementary Figure S5), suggesting the PRoBeNet biomarkers were considerably more accurate in clustering tissue samples.
These results indicate PRoBeNet can be used to find response-predicting biomarkers for both approved drugs and investigational compounds, even with few samples.